What is interference?
Basics
Suppose you wish to test whether a drug is effective at reducing a person’s blood pressure. Typically, you would assign some units to take the drug (treatment) and others to take a placebo (control). You would then contrast the outcome (blood pressure) of the units in the treatment group, to that of the units in the control group.
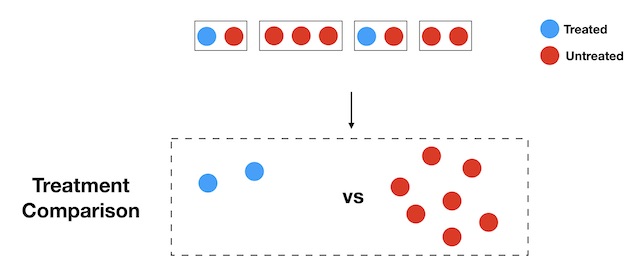
Example of treatment comparison where the experimental units belong to different households, but where that structure is ignored.
Examples of interference scenarios
Notice that in this particular example, it seems reasonable to assume that a drug pill (treatment) affects only the blood pressure (outcome) of the particular unit who takes that pill. In more general terms, an individual unit’s treatment assignment affects only its own outcome: we say that there is no interference between units. In contrast, if a unit’s treatment assignment may affect another unit’s outcome, we say that there is interference between units.
The best way to get familiar with the idea is to consider a few examples:
Example 1: SDP example (Rogers and Feller 2016)
An important challenge that the school districts across the US face is a high student-absence rate: 10% of students in K-12 schools are chronically absent, meaning that they miss more than 18 days of school in the year. In a recent paper, Rogers and Feller studied the effectiveness of a mail-based intervention, with the following design: they randomly selected households with children attending K-12 in the School District of Philadelphia. Within these selected households (let’s call them “treated” household), they selected at random one of the children attending K-12 (if more than one) and sent information to the parents about that child’s current absence rate. While the intervention was ostensibly aimed at reducing the absence rate of the child targeted by the intervention, Basse and Feller (2018) showed that the intervention also affects the siblings of targeted children.
Example 2: Get out the vote experiment (Bond et al. 2012)
In a study designed to assess the effectiveness of a get-out-the-vote intervention on facebook, Bond and colleagues sent messages to 60 million facebook users encouraging them to go out and vote. They found that not only the intervention increased the probability of the treated individuals (i.e. those who received the intervention) to vote: the intervention also increased the probability that their close friends would vote!
Example 3: 401k investment example (Duflo and Saez 2003)
Duflo and Saez designed an experiment to study the determinants of an employee’s choice to sign-up for a tax deferred retirement account at a large university. As part of this study, they randomly selected a number of departments, and within those departments, they randomly selected a number of employees to whom they sent an encouragement to participate in a “benefits information fair” (the encouragement included some money). They note that the intervention “multiplied by more than five the attendance rate of these treated individuals (relative to controls), and tripled that of untreated individuals within departments where some individuals were treated.”
What can go wrong if I ignore interference?
Comparing apples and oranges
The strategy illustrated in Figure 1 works well if there is no interference between units, but things can go very wrong if units interfere with each other. To understand what the problem is consider the household example from Rogers and Feller 2016, described above. Although the treatment status is binary (a unit is treated or control), there are, in fact, three effective treatment statuses: a unit can be treated (pure treated), it can be untreated but have a sibling treated (exposed), or it can be untreated and have no sibling treated (pure control).
Notice, in particular, how untreated units may either be pure control or exposed. The comparison of Figure 1 between treated and untreated units now looks as follows:
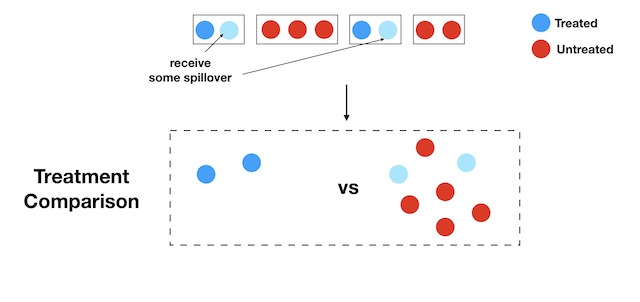
The “control group” now contains a mix of pure control units, and exposed units: the treatment has spilled over to the control group!
So what?
Well, suppose that the effect of receiving the treatment directly is almost the same as receiving spillovers from treatment (this is not so unlikely — Basse and Feller (2018) found spillovers roughly half as large as the direct effect). Then the average response in the “control group” is inflated by the presence of spillover units: this may lead to severe bias (in this case, you would underestimate the effect of your intervention).
How much bias? It depends on what you are willing to assume about the interference structure, but if you believe that the treatment assignment of any unit may affect any other unit’s response arbitrarily, then the bias may be arbitrarily bad.
What is the direction of the bias?
In the examples we’ve presented so far, it seems—at least intuitively—that the bias is gently pulling us towards 0. So is this always true? Does interference just slightly dilute the effect? The simple answer is no. There are many other examples where interference can arbitrarily change the sign and magnitude of an effect. This is particularly prominent when experimental units are competing for a limited resource; for example, in marketplaces.
Consider a ridesharing firm that has developed a new pricing algorithm. Their hope is that this innovation will reduce both wait time for passengers and increase revenue for drivers (and in turn the firm) by introducing a temporary price increase in areas where demand exceeds supply. Now, let’s imagine running an experiment in Boston, where for every driver we flip an unbiased coin: if lands heads the driver is assigned to the algorithm; if it lands tails they stick with the current approach. Focusing on revenue, suppose the experiment has a negative effect, that is, if everyone were assigned to the new version (or treatment) then the company would generate less revenue as fewer riders would be willing to pay the higher prices. But in the experiment, the drivers in the treatment group are sent to the busier areas and so they pick up more drivers at a higher price. The results say that the treatment is generating a lot more revenue than the control. But there are two things happening. The first is that there is a redistribution where the revenue is shifting from being evenly spread amongst all the drivers to being more concentrated in the treatment group. The second is that the overall revenue is actually going down! When all the drivers start to receive treatment this redistribution will no longer occur and so the perceived positive effect will disappear.
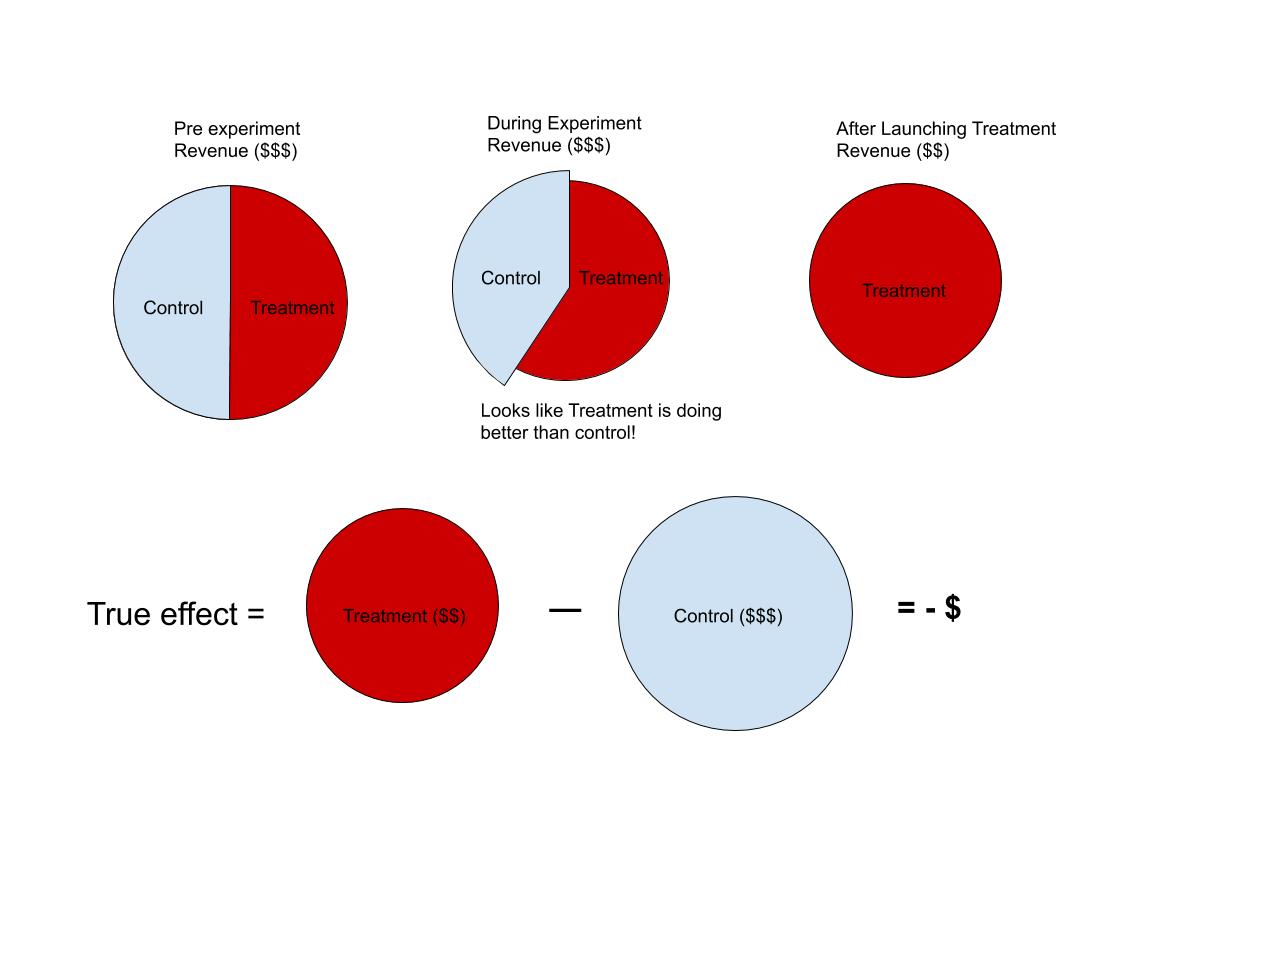
When the experimental units are competing for a limited resource more experiments perform a redistribution between treatment and control—making it seem like there is a positive or negative effect when really it’s just 0.
What can I do about it?
Design
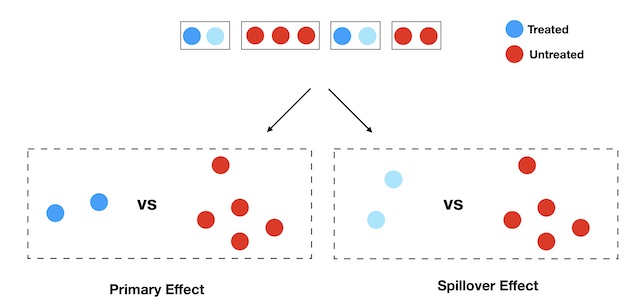
Many authors have proposed different experimental designs to either alleviate the interference or to directly measure it. At the heart of most of these designs is a simple idea of creating groups such that most of the interference is contained within the group and there is little (or usually none) across the groups. Once these groups have been defined, we can vary treatment across the groups as well as within the groups. Typically the cross-group variation allows us to measure average treatment effect whereas the within-group variations allows for the estimation of the spillovers.
An alternative approach that has also gained a lot of popularity in technology companies is to use switchback (or time series experiments). This class of experiments treats the city as a single unit and alternates the treatment over time, thereby translating the problem of interference across drivers into a problem of interference over time. This approach will be the object of another post.
Analysis
Analyzing a well-designed study that is subject to interference is—although trickier than a study with no interference—relatively straightforward. The main idea is to continue respecting the isolation generated in the design phase and only focus on well-specified contrasts, as illustrated below. One thing to keep in mind is that we still need to normalize each observation by the appropriate treatment exposure probabilities. Without proper normalization, even isolated contrasts can lead to biased results.
Mind the gap: from intuition to formalization
In trying to provide helpful intuition, we have brushed a number of important details under the proverbial rug. We conclude this note by pointing out the holes and over-simplifications in our treatment of the subject and provide some starting points for a fuller understanding of the subject.
- Assumption on the interference structure. In Figure 1, we noted that the siblings of treated units received “some spillover,” but how do we know that these spillovers don’t also affect units in untreated households? We don’t –– this is an assumption we have implicitly made on the interference mechanism. Such assumptions are generally formulated via the concept of exposure mapping.
- Defining the effects of interest. Throughout this note, we have thrown around the words direct effect and spillover effect without defining them formally. While it is easy to get an “intuitive” understanding of these, this intuition can be misleading in more complex situations. Rigorously defining these effects requires quite a bit of formalism.
- Spillover or spillovers? An important idea that gets lost in our oversimplification is the fact that there is, in general, no single unambiguous definition of “spillover effect”. Instead, there are many possible “spillover effects”, and one must be clear about which one they are interested in.
- Analysis. A popular approach is to rely on inverse probability weighted estimators (e.g. Horvitz-Thompson and Hajek). There is an ongoing research effort to provide a satisfactory asymptotic theory for a large class of designs and interference structures.
For an accessible introduction to the main formalism, we suggest starting out with Basse and Feller 2018, and then Aronow and Samii 2017: the former focuses on a special case of the latter, which might make it more accessible as a starting point. For an example of marketplace interference, see Basse et al. 2016. For recent advances in the asymptotic theory, see Leung 2020 and Chin 2019. For different designs, see Ugander et al. 2013, Rogers and Feller 2016, Baird et al. 2018., and Saint-Jacque et al. 2019.
References
Aronow, P. M., & Samii, C. (2017). Estimating average causal effects under general interference, with application to a social network experiment. The Annals of Applied Statistics, 11(4), 1912-1947.
Baird, S., Bohren, J. A., McIntosh, C., & Özler, B. (2018). Optimal design of experiments in the presence of interference. Review of Economics and Statistics, 100(5), 844-860.
Basse, G., & Feller, A. (2018). Analyzing two-stage experiments in the presence of interference. Journal of the American Statistical Association, 113(521), 41-55.
Basse, G. W., Soufiani, H. A., & Lambert, D. (2016, May). Randomization and the pernicious effects of limited budgets on auction experiments. In Artificial Intelligence and Statistics (pp. 1412-1420).
Bond, R. M., Fariss, C. J., Jones, J. J., Kramer, A. D., Marlow, C., Settle, J. E., & Fowler, J. H. (2012). A 61-million-person experiment in social influence and political mobilization. Nature, 489(7415), 295-298.
Chin, A. (2018). Central limit theorems via Stein’s method for randomized experiments under interference. arXiv preprint arXiv:1804.03105.
Duflo, E., & Saez, E. (2003). The role of information and social interactions in retirement plan decisions: Evidence from a randomized experiment. The Quarterly journal of economics, 118(3), 815-842.
Leung, M. P. (2020). Treatment and spillover effects under network interference. Review of Economics and Statistics, 102(2), 368-380.
Saint-Jacques, G., Varshney, M., Simpson, J., & Xu, Y. (2019). Using Ego-Clusters to Measure Network Effects at LinkedIn. arXiv preprint arXiv:1903.08755.
Rogers, T., & Feller, A. (2016). Discouraged by peer excellence: Exposure to exemplary peer performance causes quitting. Psychological science, 27(3), 365-374.
Ugander, J., Karrer, B., Backstrom, L., & Kleinberg, J. (2013). Graph cluster randomization: Network exposure to multiple universes. In Proceedings of the 19th ACM SIGKDD international conference on Knowledge discovery and data mining (pp. 329-337).